
Whether you're a beginner or an experienced trader, you can expand your knowledge on Bollinger Bands and get equipped with a few simple trading strategies using them.
In our two-part series on Bollinger Bands, we will explain how the Bollinger Bands work and how they can be used for trading. We will also take up some simple yet effective trading strategies that use Bollinger Bands to maximise profits and minimise risks.
Bollinger Bands know-how
Bollinger Bands are a technical indicator used by traders and investors to understand how overstretched the prices are on either side when compared to the mean i.e. the 20-day moving average. They can be easily found on any trading platform and looks like this when applied:
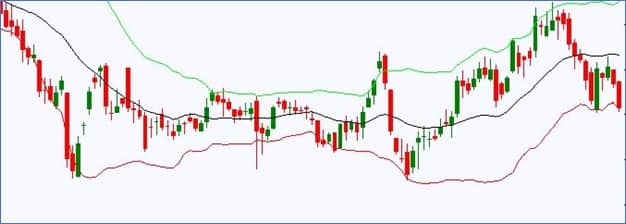
As you can see, the prices are surrounded by the “Bands” (thus the name) on both sides. The green line above the price is 2 standard deviations above the mean, and the red line below the price is 2 standard deviations below the mean.
When prices touch the upper bands, there is a tendency for them to go down and revert to the mean or towards the lower band. However, when prices touch the lower bands, they tend to go up and revert to the mean or towards the upper band. This happens because Bollinger Bands are put together based on the principles of the bell curve.
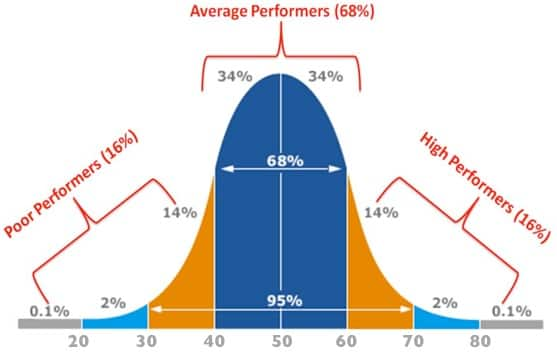
For beginners, whenever you plot a random set of data, like the weight of people, height or income levels on a chart, it will take the form of a bell curve. Meaning, the majority of the data will be stacked at the midpoint of the bell curve. There will be some outliers towards the extreme right and to the extreme left.
Organisations often use bell curves for performance appraisals. Most of the performers will be around the middle, who have performed in line with expectations, there will be a few outperformers, who will be on the extreme right, and there will be some underperformers on the extreme left.
In financial markets, when we apply the same concept, the expectation will be that most times prices will trade around the midpoint (the 20-day moving average). There will be times when the prices move too far up, making them over-stretched on the upper band and there will also be times when the prices move too far down, making them overstretched on the lower bands. This is what provides opportunities for a trader.
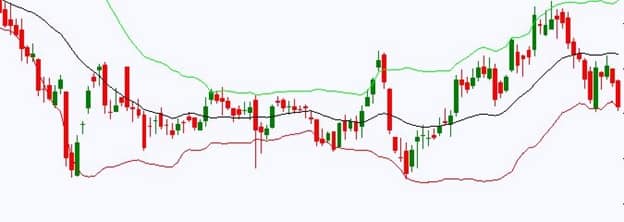
However, trading is not and will not be as easy as saying, “buy at lower band/ sell at upper band & walk your way to the bank”. If it were so, everyone would be doing it already. So, while Bollinger Bands provide a tremendous edge to a trader, like any other technical indicator, they need to be used responsibly too.
We will outline three trading strategies using Bollinger Bands.
Strategy 1- How to Play the squeeze
Strategy 2 – Buy the “W” & sell the “M”
Strategy 3 – How to use ‘Walking the Bands’ to your advantage
Strategy 1 – Playing the Squeeze
Strategy 1 – Playing the Squeeze
A simple yet effective strategy using Bollinger Bands is playing the Bollinger Bands Squeeze. The bands are driven by volatility and a squeeze is purely a reflection of that volatility. Squeeze essentially means the upper and lower bands come very close to each other (as you can see in the picture below), showing volatility contraction.

A period of low volatility is often followed by high volatility.
Typically, traders trade in the direction of a break. For example, post the squeeze, if the first candle closes above the upper Bollinger Band by more than 50 percent, it is often an indication that prices are destined to move up and vice versa (picture below).
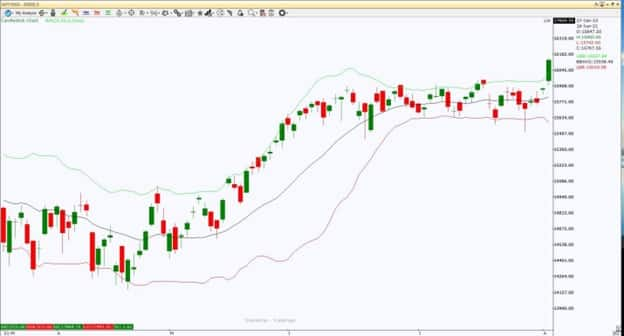 (Squeeze followed by Breakout)
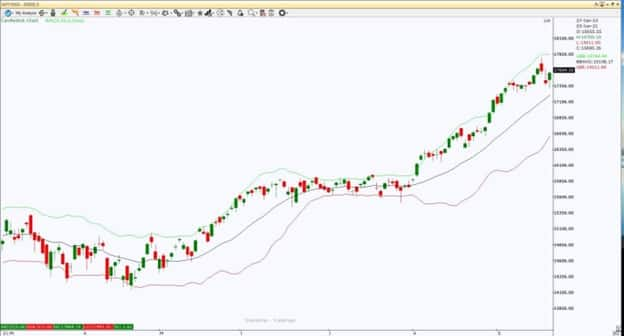 (Squeeze followed by Breakout- The Outcome)
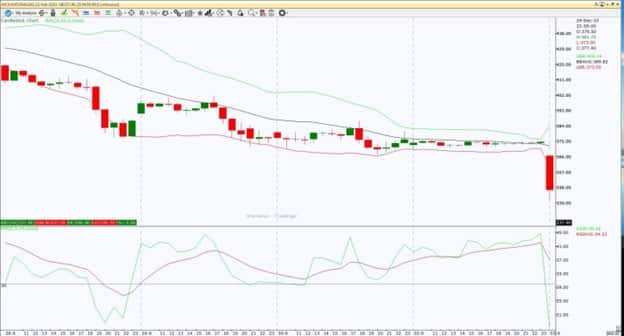 (Squeeze picture followed by Break Down)
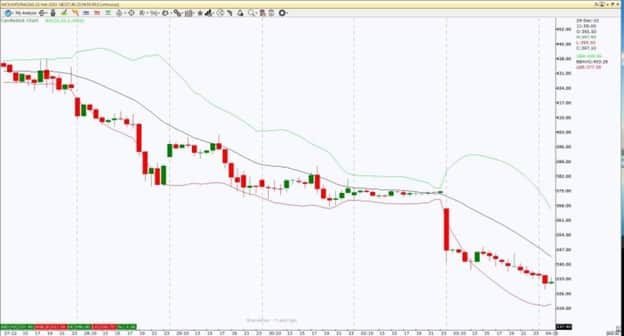 (Squeeze followed by breakdown – The Outcome)
Another popular method of trading the squeeze is used by options traders. If a Bollinger Band squeeze is observed in a low implied volatility environment, option traders often tend to buy straddles/ strangles. Since the breakout/ breakdown post the squeeze is expected but the direction is not clear, options traders benefit by buying straddles or strangles.
For beginners, long straddles/ strangles make money as long as the "underlying" moves sharply in either direction. They are often referred to as Bi-Directional Strategies.
To conclude, Bollinger Bands, are a very powerful indicator and a must-use tool in every trader’s arsenal. These strategies are very effective in predicting price movements on the chart.
We will explain the remaining two strategies in detail in the next part of this series. Watch this space.
(This is the first article in a two-part series on Bollinger Bands)
Disclaimer: The views and investment tips expressed by investment experts on Moneycontrol.com are their own and not those of the website or its management. Moneycontrol.com advises users to check with certified experts before taking any investment decisions.