The market traded within a range throughout the session on Monday, though it rebounded after two days of correction and closed in green. Largely, the Nifty50 traded within Friday's range and finally formed a Doji kind of pattern on the daily scale as the closing was almost equal to opening levels, indicating bulls and bears are indecisive about their future market trend.
Last couple of sessions indicated that 16,900 is acting as a support for the market and 17,100-17,150 area is playing a role of hurdle on the higher side.
The index climbed 41 points to 16,986, while the BSE Sensex gained nearly 130 points at 57,654. However, the breadth was in control of bears, which resulted into a loss of half percent on the Nifty Midcap 100 and 1.6 percent decline on the Nifty Smallcap 100 index.
About four shares declined for every rising share on the NSE, while the key sectoral indices largely closed around flatline.
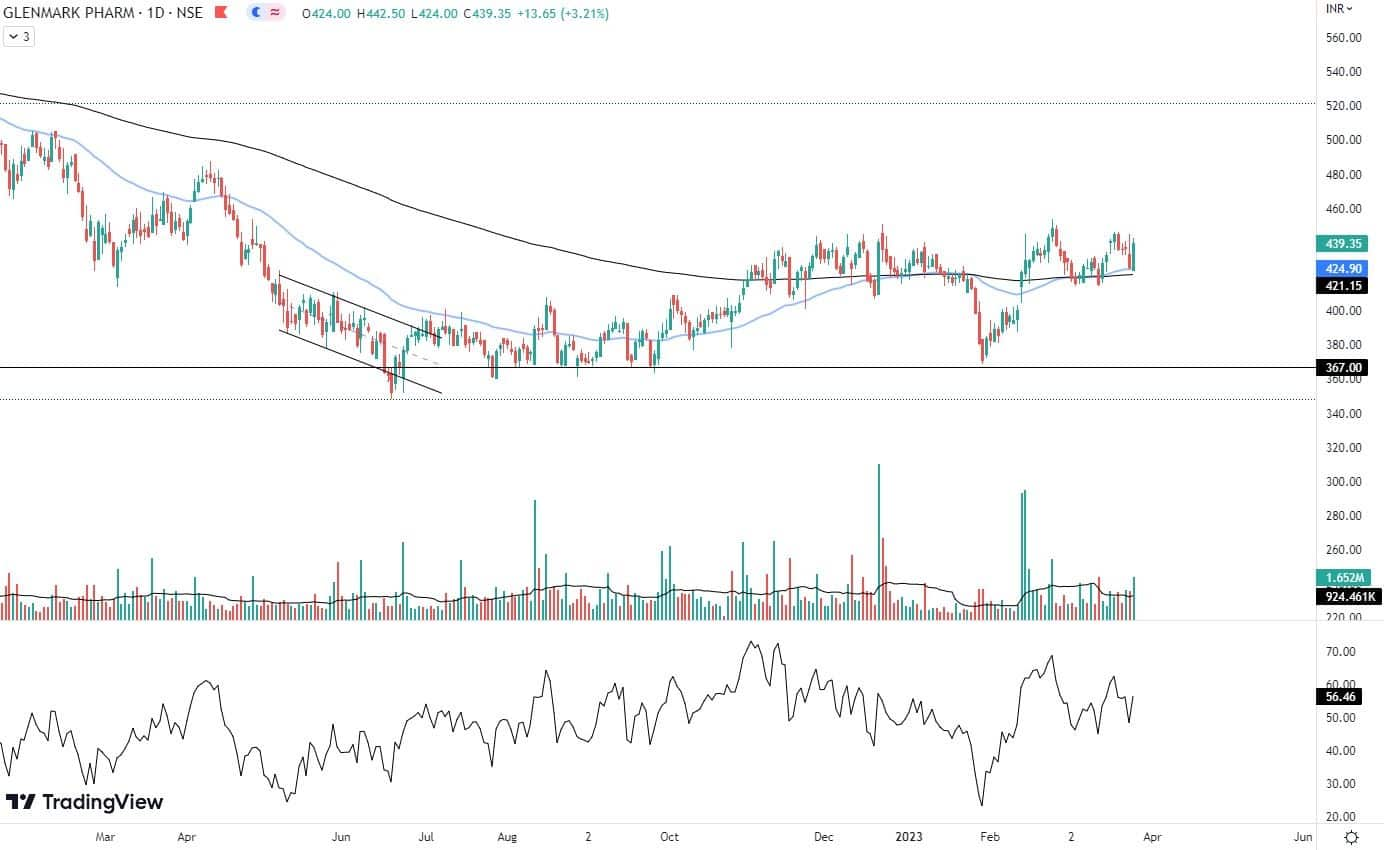
Stocks that were in action included Glenmark Pharma which jumped over 3 percent to Rs Rs 439 and formed Bullish Engulfing kind of pattern on the daily charts with above average volumes. The stock climbed back above all key moving averages (21, 50, 100 and 200-day EMA - exponential moving average).
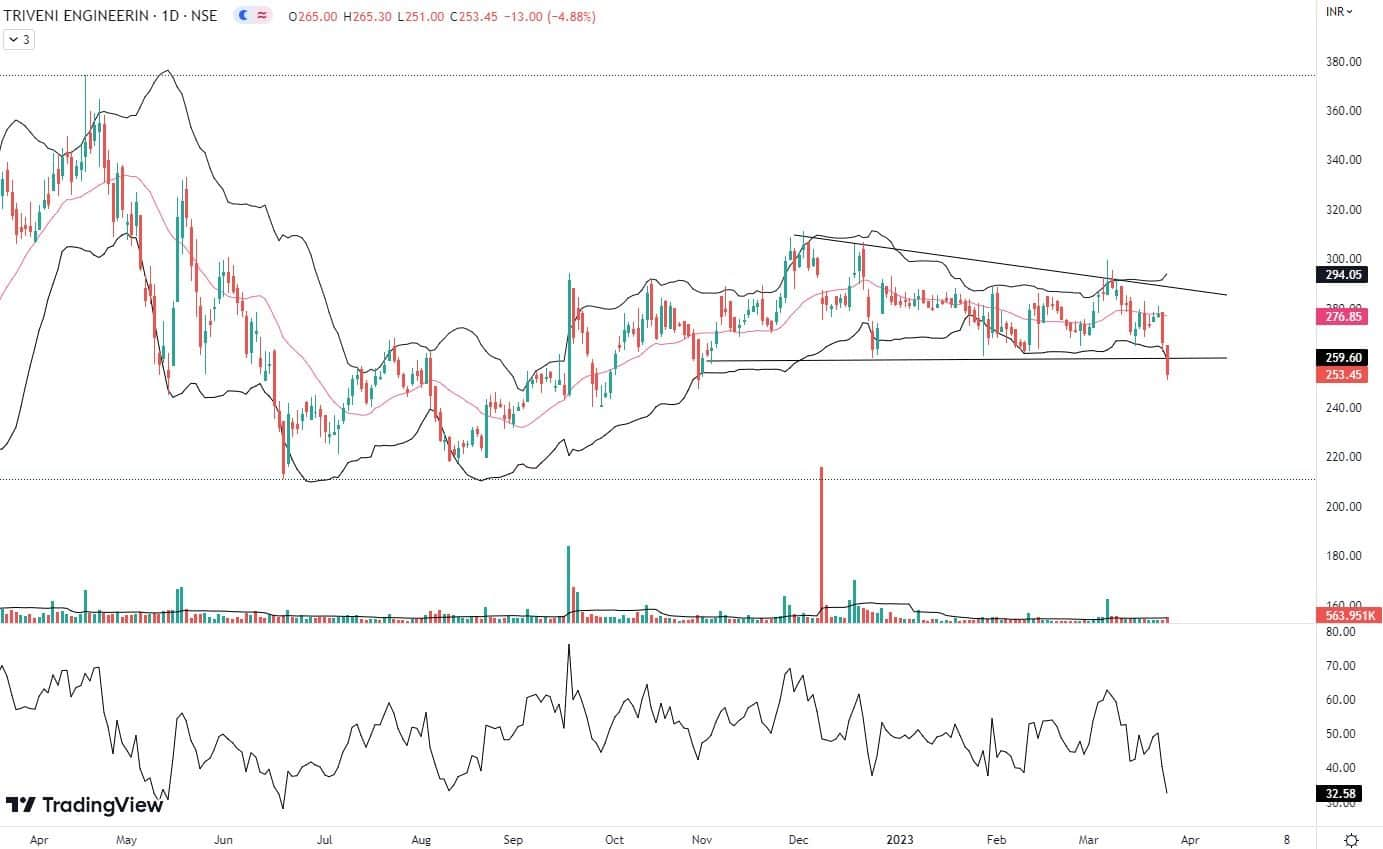
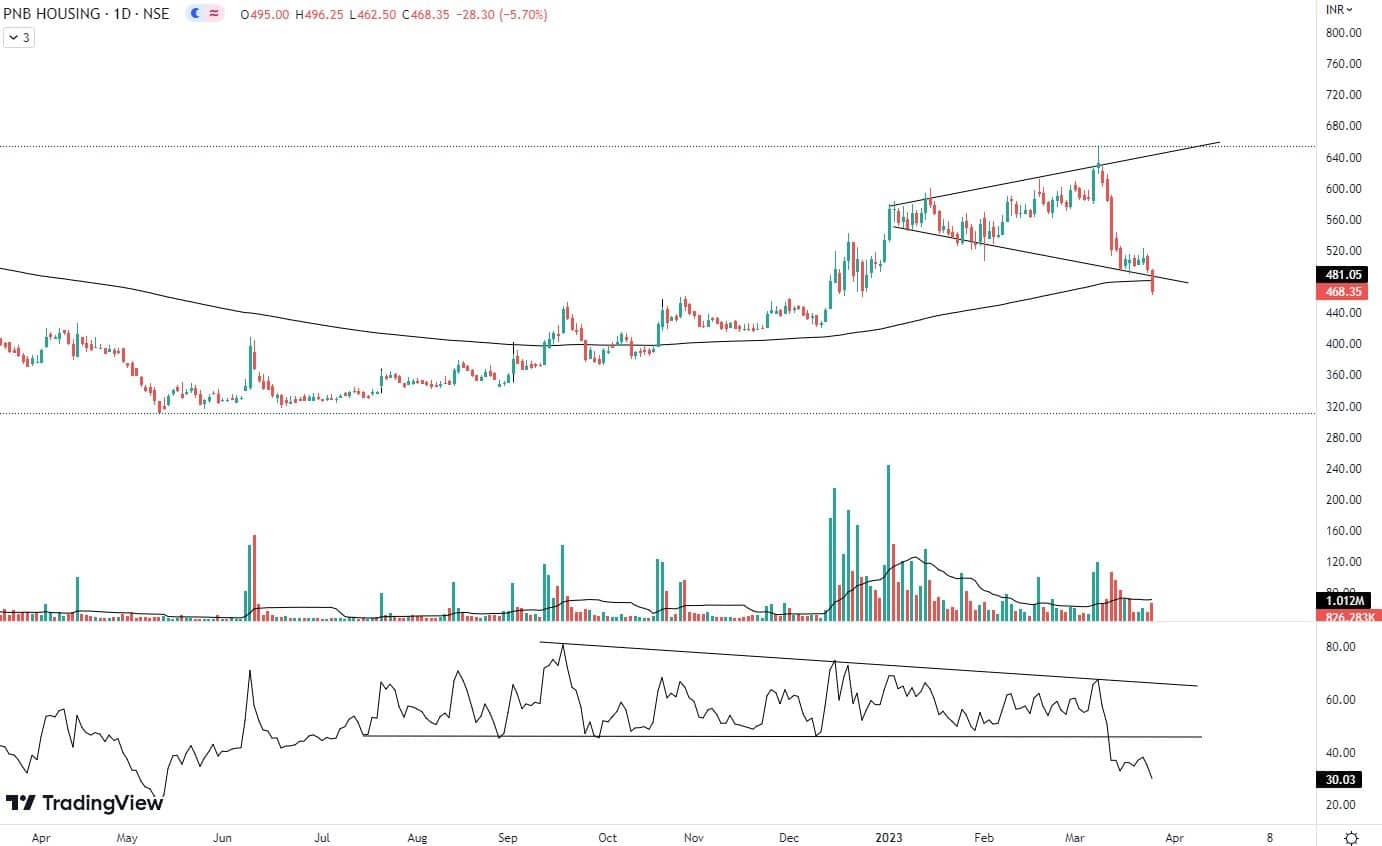
However, on the negative side, PNB Housing Finance and Triveni Engineering were in focus, falling 5.7 percent to Rs 468 and nearly 5 percent to Rs 253.
PNB Housing Finance has formed long bearish candlestick pattern on the daily scale after breaking down bearish Flag and Pole pattern, generally indicating may be more weakness going ahead. Further it has decisively fallen below 200-day EMA (Rs 481) as well, though trading volume was slightly below average.
Triveni Engineering and Industries also formed big bearish candle on the daily scale with widening of Bollinger band on the lower as well as upper side with Monday's fall. Also it has decisively broken lower threshold of channel.
Here's what Vidnyan Sawant of GEPL Capital recommends investors should do with these stocks when the market resumes trading today:
Glenmark's stock experienced a rebound to the positive direction, as it found support at a significant level of Rs 370. This level has been holding steady since June 2022, with the stock's prices consistently staying in close proximity to it.
A Golden Cross has occurred between the 50 and 200-day EMA for the stock, suggesting the start of a bullish trend. This development indicates a positive shift in the stock's momentum and could signal an upward movement in its price.
The RSI (relative strength index) for the stock has remained consistently above the 50 mark on both the daily and weekly charts, reflecting a sustained increase in momentum behind its price movements.
We recommend traders and investors to hold this stock for the target of Rs 486 where the stop-loss must be Rs 410 strictly on the closing basis.

Triveni Engineering and Industries
Triveni Engineering's stock has recently breached the crucial support level of Rs 263, indicating a bearish sentiment and negative trend in its prices. This suggests that the selling pressure has been strong enough to push the stock below this key level, potentially leading to further price declines.
A Descending Triangle pattern for the stock has recently been broken, signalling a potential bearish reversal in its price trend. This breakdown indicates that the stock's prices may continue to trend downward, as the selling pressure may be gaining momentum.
On the daily timeframe, the Bollinger band for the stock has begun to widen, indicating an increase in price volatility.
The momentum indicator RSI on the daily time frame has shown a breakdown too which reflects the lack of positive momentum.
We recommend traders and investors to exit this stock.

On March 13, 2023, the weekly chart of PNB Housing showed a Shooting Star candle pattern breakdown, indicating a bearish sentiment in the price movement.
The Expanding triangle pattern's recent breakdown, it appears that the downtrend is set to continue.
The stock has breached below the 200-day EMA confirming the beginning of the trend towards downside.
The momentum indicator RSI on the daily time frame has shown a breakdown too which reflects the lack of positive momentum.
We recommend traders and investors to exit this stock.

Disclaimer: The views and investment tips expressed by investment experts on Moneycontrol.com are their own and not those of the website or its management. Moneycontrol.com advises users to check with certified experts before taking any investment decisions.